The U. S. Census Bureau’s latest state population estimates were released in December. These numbers demonstrate the continuing trend of a population shift away from the Northeast and Midwest and towards the South and West. Not surprisingly, the states with the largest population gains (in raw numbers) from July 2016 to July 2017 were Texas, Florida, California, Washington, and North Carolina. However, the list of fastest growing states may surprise some. Between July 2016 and July 2017, the states with the highest rate of estimated growth were Idaho, Nevada, Utah, Washington, and Florida. The table below shows the estimated 2017 population, the change in population from 2016 to 2017, and the rate of growth for the states in both lists.
| States Adding Most Population, 2016 – 2017 | |||
| State | Pop. Estimate, 2017 | Pop. Change, 2016 – 2017 | Growth Rate, 2016 – 2017 |
|---|---|---|---|
| Texas | 28,304,596 | 399,734 | 1.4% |
| Florida | 20,984,400 | 327,811 | 1.6% |
| California | 39,536,653 | 240,177 | 0.6% |
| Washington | 7,405,743 | 124,809 | 1.7% |
| North Carolina | 10,273,419 | 116,730 | 1.1% |
| States with Highest Rate of Growth, 2016 – 2017 | |||
| State | Pop. Estimate, 2017 | Pop. Change, 2016 – 2017 | Growth Rate, 2016 – 2017 |
|---|---|---|---|
| Idaho | 1,716,943 | 36,917 | 2.2% |
| Nevada | 2,998,039 | 58,785 | 2.0% |
| Utah | 3,101,833 | 57,512 | 1.9% |
| Washington | 7,405,743 | 124,809 | 1.7% |
| Florida | 20,984,400 | 327,811 | 1.6% |
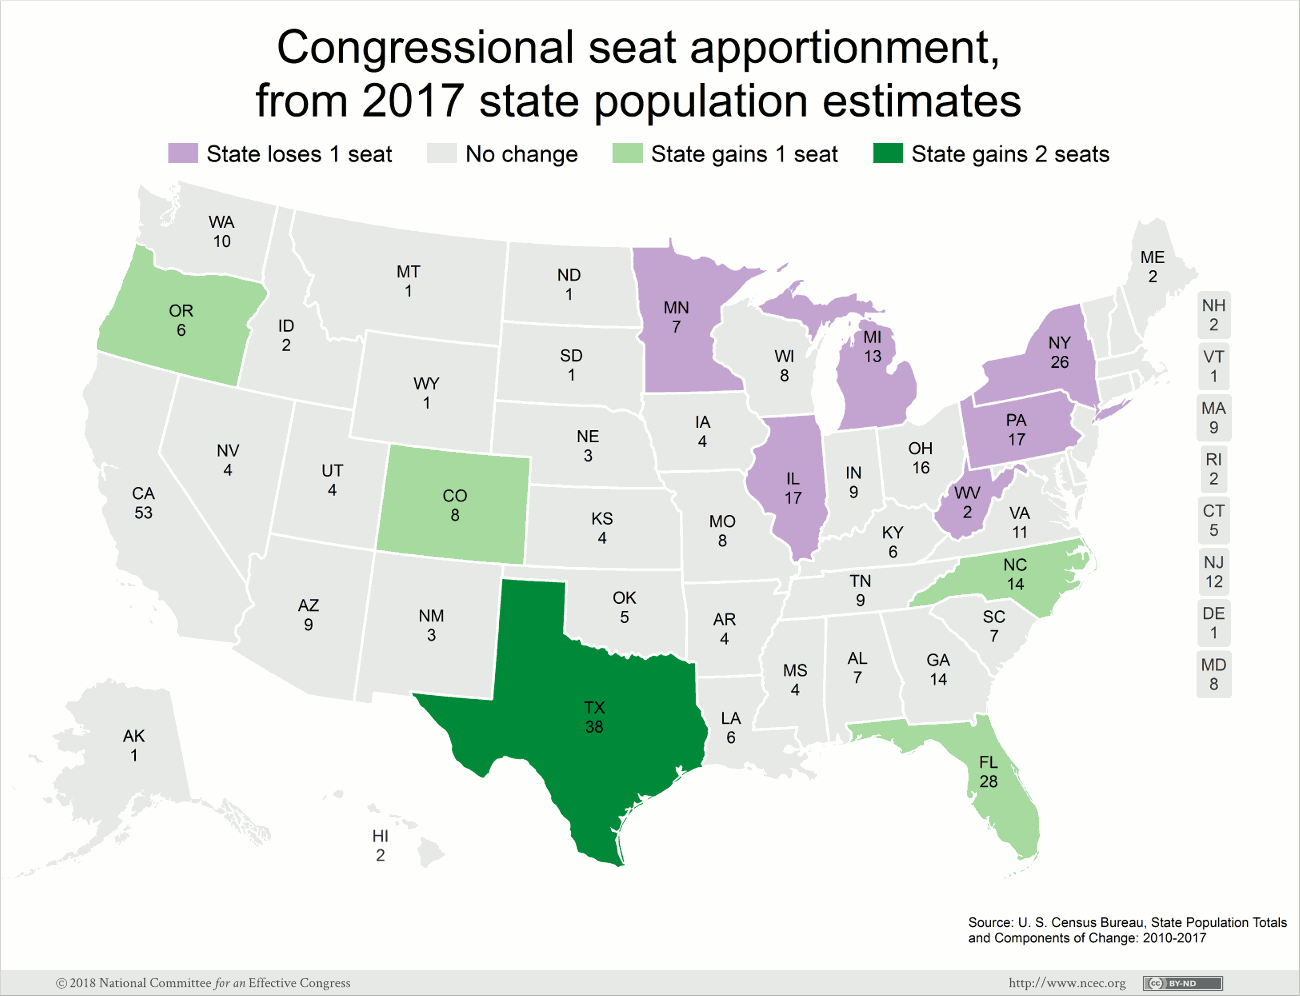
With Congressional redistricting in the near future, it is useful to analyze the potential changes arising from the next census. Based on the latest population estimates (December 2017), if reapportionment occurred right now, six states would lose one seat, while four states would gain one seat and another would gain two seats. The states expected to lose a seat are Illinois, Michigan, Minnesota, New York, Pennsylvania, and West Virginia. Likewise, the states expected to gain seats are Colorado (1), Florida (1), North Carolina (1), Oregon (1), and Texas (2). These changes are illustrated in the following map.
This shift in population is a continuation of a trend measured in the 2010 Census when Florida and Texas both gained seats. North Carolina narrowly missed gaining an additional seat in 2011. Further, the anticipated addition of a seat in Oregon indicates continued growth in the Pacific Northwest, as neighboring Washington previously gained a seat in 2011.
Stagnant growth is apparent among states losing population as well—Illinois, Michigan, New York, and Pennsylvania all lost seats in 2011. Minnesota narrowly avoided losing a seat in 2011, receiving the 435th (final) apportioned seat, so the potential loss of a seat there is not entirely without warning.
Using the priority values that determine the order in which seats are distributed, we can look for potential changes should the trends in growth continue as they have, or if the rate in any state declines relative to others. The following table shows the final 10 seats to be apportioned based on these estimates, and the next 10 seats that would be apportioned if the House of Representatives was larger than 435 members. With three years to go before the next census, we could still see states from the bottom 10 in this list displace any from the 10 top states.
| Seat apportionment order, from 2017 state population estimates | ||
| House Seat | State | State Seat |
|---|---|---|
| 426 | California | 52 |
| 427 | Florida | 28 |
| 428 | North Carolina | 14 |
| 429 | Oregon | 6 |
| 430 | Texas | 38 |
| 431 | California | 53 |
| 432 | Ohio | 16 |
| 433 | Alabama | 7 |
| 434 | Colorado | 8 |
| 435 | Rhode Island | 2 |
| 436 | New York | 27 |
| 437 | Minnesota | 8 |
| 438 | Montana | 2 |
| 439 | West Virginia | 3 |
| 440 | Arizona | 10 |
| 441 | California | 54 |
| 442 | Michigan | 14 |
| 443 | Virginia | 12 |
| 444 | Florida | 29 |
| 445 | Texas | 39 |
Several things stand out from this list. Two notable entries are Ohio and Alabama, representing seat numbers 432 and 433, respectively. This means both states are on the verge of losing a seat. Ohio lost two seats as a result of the 2010 Census, and losing another would undoubtedly cast a blow to the state’s influence. Alabama’s seventh seat was ranked 421 following the 2010 Census, so this slide could foreshadow the eventual shift of a seat out of the state. Moreover, Louisiana lost a seat in 2011 (largely due to Hurricane Katrina), and a seat moving away from Alabama would signify further decline along the northern Gulf coast.
In this scenario Rhode Island is set to receive the final congressional seat, but notice that Montana is third in line to receive another seat. A reversal of this order would definitely change political fortunes in those two states. Finally, New York is narrowly expected to lose one more seat in addition to the two seats the state lost after the 2010 Census. This change would further highlight the regional shifts that have occurred, and signals that the trend is sure to continue into the future.