Donald Trump increasingly finds himself in a precarious political position, as the scandal involving Russian collusion with his campaign creeps ever closer to the Oval Office. But the question remains, will this controversy translate into a Democratic wave? Over the next 17 months, political pundits will offer a myriad of predictions attempting to correctly guess the outcome of the next general election. Presently, an oft-cited parallel is 2006, when the Democrats captured both the House and Senate, powered by an unpopular Republican president and a series of scandals that enveloped the Republican Party. Do the many controversies currently swirling around the White House ensure a similar fate for the Republicans in 2018? It’s too soon to tell, but there are many tried-and-true indicators that have proven accurate in years past, which will help you make sense of the political environment.
It’s all About Trump
During the campaign, President Trump obsessed over his standing in the polls. Similarly, the eyes of the political world will be on his approval rating as the next midterm election approaches. In years past, presidential approval has been an accurate measure of his party’s fate in congressional elections. The more unpopular a president, the deeper the losses his party will likely sustain. Recent wave elections provide a perfect demonstration of this continued truth.
| President | Midterm Election | July Previous Year Approval Rating | Election Night Approval | Seat Change |
|---|---|---|---|---|
| Nixon | 1970 | 63% | 58% | -12 |
| Ford | 1974 | N/A | 53% | -48 |
| Carter | 1978 | 66% | 49% | -15 |
| Reagan | 1982 | 59% | 42% | -26 |
| Reagan | 1986 | 67% | 64% | -5 |
| Bush | 1990 | 66% | 57% | -8 |
| Clinton | 1994 | 41% | 45% | -52 |
| Clinton | 1998 | 58% | 65% | +5 |
| Bush | 2002 | 55% | 67% | +8 |
| Bush | 2006 | 48% | 37% | -30 |
| Obama | 2010 | 46% | 45% | -63 |
| Obama | 2014 | 45% | 41% | -13 |
| Trump | 2018 | 38% | N/A | N/A |
In 2010 when the Democrats lost a staggering 63 House seats, President Obama’s job approval ratings had dropped consistently due in part to the prolonged debate over healthcare reform. In all, his approval rating dropped by 18.3 percentage points over the first 28 months of his presidency. By the eve of the election, his approval stood at 44.9 percent following a consistent slide in successive quarters.
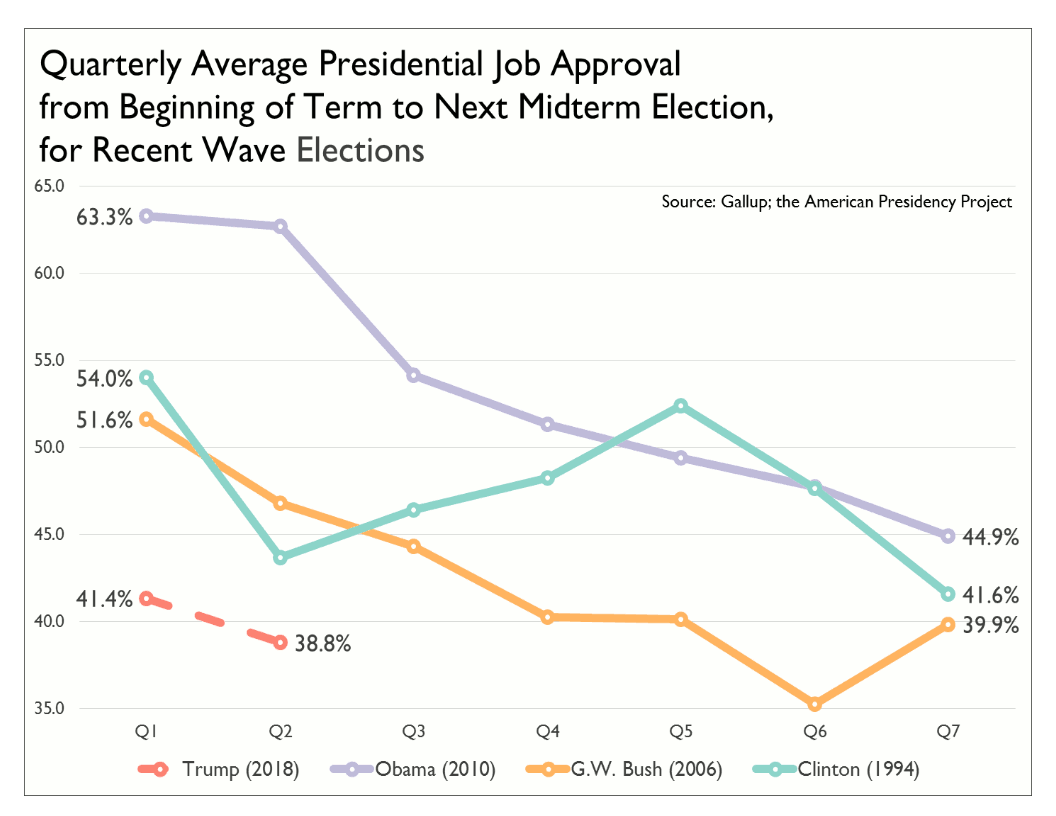
Likewise in 2006, President George W. Bush’s approval rating was hampered by an increasingly unpopular war in Iraq, the botched response to Hurricane Katrina, and a series of damaging ethics scandals that rocked Republican congressional ranks. Bush’s approval rating dipped to just 37 percent on the eve of the election, which led in part to a net gain of 30 seats for the Democrats that year.
President Trump’s approval rating has dipped far more quickly than his recent predecessors, which could signal an increasingly positive environment for the Democrats. In fact, he registered the lowest second-quarter average of any US president in almost 60 years. However, with 17 months remaining until the election he has time to rebound. Should his approval remain mired in the high 30s though, the Democrats could be positioned for big gains on Election Day, 2018.
Voter Enthusiasm
Another useful metric to watch as the next election approaches is voter enthusiasm. Naturally, the party out of power experiences an increase in enthusiasm after an election loss. At the same time, supporters of the party in power can lose passion watching their side engaged in nagging legislative skirmishes. But when these numbers spike, it can be indicative of a wave election.
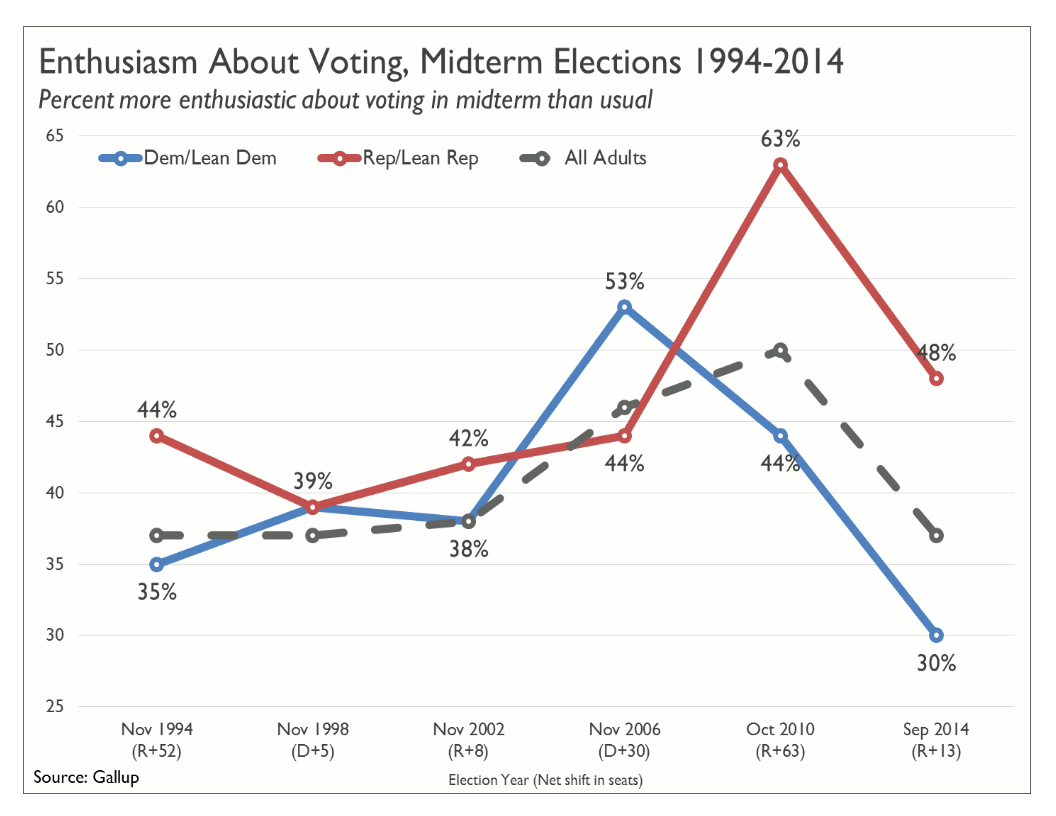
Recent elections have shown that a near-double-digit advantage in voter enthusiasm translates into significant seat changes. For example, in 1994, 2006, 2010, and 2014, large gaps in voter enthusiasm in the final weeks prior to the election foreshadowed the results. On the contrary, when no significant enthusiasm gap exists, the seat changes are generally within single-digits, as was the case in 1998 and 2002. No current measure of voter enthusiasm exists yet for the 2018 cycle, but an April 2017 report by Public Policy Polling (PPP) gave the Democrats a substantial advantage. However, a contradictory ABC/Washington Post poll from mid-July 2017 suggests a Republican advantage. According to that poll, 65 percent of Republican or Republican-leaning voters are “certain” to vote in 2018, compared to just 57 percent of voters who are Democrats or lean-Democratic.
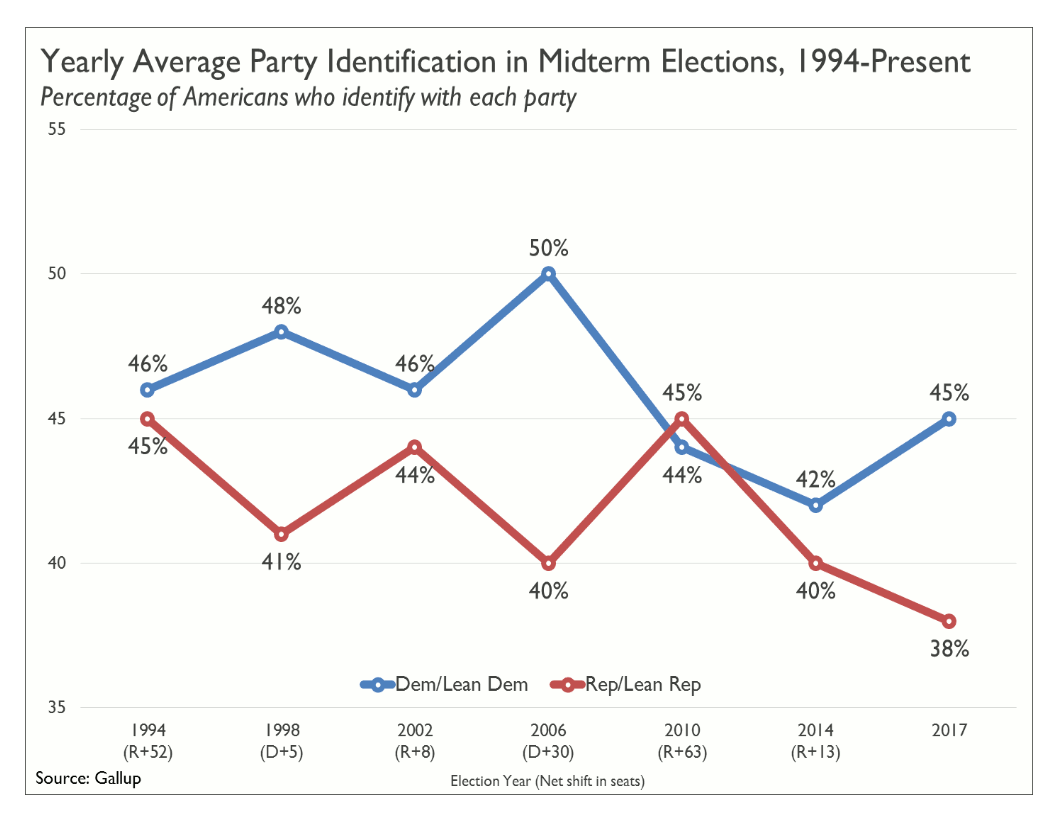
Party Identification
As with voter enthusiasm, a noticeable swing in party identification can also point to a potential coming wave. While an increasing share of Americans now commonly self-identify as Independents, they usually indicate a “lean” or slight preference for either party. This measurement—which includes leaners—provides a clear sense of the political winds. During previous wave elections, the party with the political advantage experienced a tangible increase in the share of voters identifying with them. The most recent polls are showing a slight uptick in Democratic Party identification to 7 points, up from 2 points in 2014.
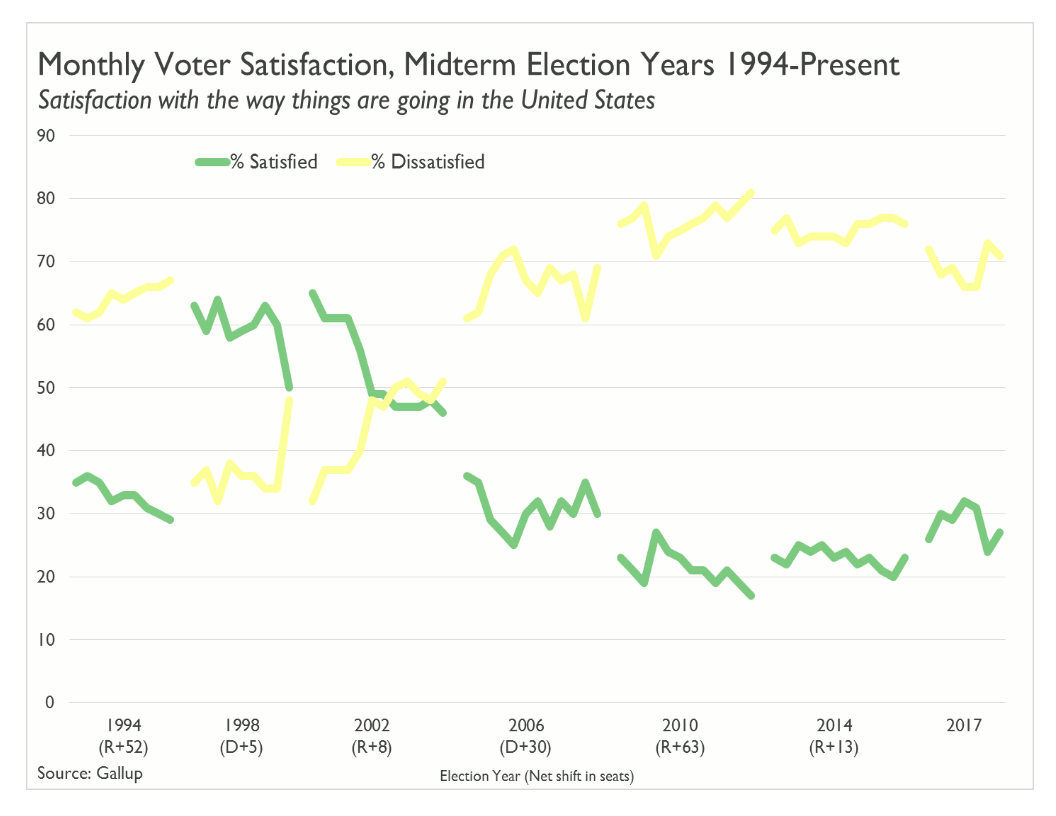
Direction of the Country
When Americans are in a pessimistic mood, it spells trouble for the party in power. Polling that measures voter satisfaction level is the last traditional metric that we highlight. Attitudes about how things are going have been historically negative over the last decade. According to Gallup, since July 2005 fewer than 40 percent of Americans have been satisfied with the state of the country. Despite the consistency of the pessimism, there are still peaks and valleys that demonstrate shifts in the public mood, particularly as elections approach. When the Republicans regained control of the House in 2010, the level of satisfaction was only 19 percent among adults, an 8-point drop from the peak in April of that year. While the outlook for the past year was generally higher than the previous few, currently the mood of the country is darkening. The most recent measure by Gallup shows that just 27 percent are currently satisfied with the way things are going in the United States- a 10-point drop from the eve of the 2016 election.
Generic Congressional Ballot—Reason for Pause
One of the most oft-cited metrics of a midterm election is the generic congressional ballot, which measures general voter preference between the two parties. The most recent generic ballot polls may give Democrats a cause for concern, since despite President Trump’s unpopularity and motivation among their base, the poll remains very close. In previous election cycles where a wave materialized, the party with the advantage enjoyed an almost double-digit lead. In 2006, the Democrats enjoyed a generic ballot advantage that fluctuated between 10 and 18 points for the 15 months preceding the election. In contrast, the most recent generic ballot polling shows that public sentiment has yet to shift to that degree, as the Democrats currently enjoy a smaller lead averaging 9.0 points.
Generic Ballot Poll Average at Midterm Election, 1994 – Present:
| Congressional Standing of President’s Party |
||||
|---|---|---|---|---|
| Election Year | Democrats | Republicans | Spread | Net Shift in Seats |
| 1994 | 42.3% | 47.8% | -5.5% | -52 |
| 1998 | 43.6% | 43.4% | +0.2% | +5 |
| 2002 | 46.0% | 47.7% | +1.7% | +8 |
| 2006 | 52.1% | 40.6% | -11.5% | -30 |
| 2010 | 41.3% | 50.7% | -9.4% | -63 |
| 2014 | 43.2% | 45.7% | -2.4% | -13 |
| 2017 | 47.8% | 38.8% | -9.0% | N/A |
| Source: CNN; PollingReport.com; Real Clear Politics | ||||
So What Does This all Mean?
If the election were held today, the Democrats would find themselves in a respectable position, with a realistic opportunity to capture the 24 seats necessary to win control of the House of Representatives. Most of the traditional indicators show that the country is souring on the President and the current situation. Recent special elections have also given reason for optimism as Democrats have consistently outpaced their traditional vote shares in heavily Republican districts, both at the congressional and state legislative level. If these results translate nationwide, it would mean massive Democratic gains in the House. However, there is reason for pause. The Republicans still have time to improve their standing—any national crisis or unifying moment could stunt the Democratic momentum. Further, the generic ballot numbers indicate that while Americans are dissatisfied with Donald Trump, they have yet to move to the Democrats.