Suburban districts have always been regarded as the battlegrounds in American politics. As demographic trends have created more diverse suburban areas lying just outside the densely populated urban corridors, exurban areas have become more competitive. In many cases, exurbs are the new suburbs of the 21st century. As the election nears, exurban and suburban counties will have an even larger impact on the scale of the potential Democratic victory.
Hillary Clinton is likely to amass substantial margins in swing state suburban counties, although a few of the Republican Senate candidates, locked in extremely close races, may run far ahead of Donald Trump. Still they may lose.
With that in mind, here is a list of emerging suburban counties in swing states to watch on Election Night.
Arapahoe County (Colorado)
We expect Hillary Clinton to perform well in the key counties that have come to define statewide contests in Colorado, which include: Adams County (7.0% expected vote share), Arapahoe County (11.2% expected vote share), Boulder County (7.0% expected vote share), Jefferson County (11.9% expected vote share), and Larimer County (7.0% expected vote share).
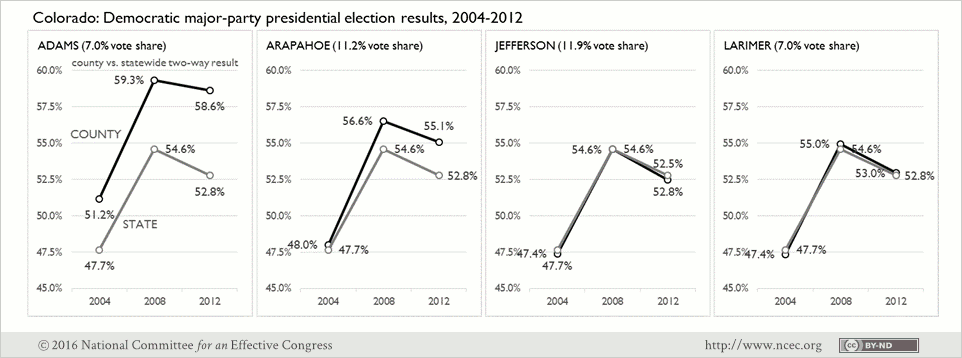
Arapahoe County may be particularly influential. The county has experienced rapid growth since the turn of the century; that growth has altered the composition of the electorate. In 2004, John Kerry lost Arapahoe County, receiving 48 percent of the vote. Conversely, President Obama carried Arapahoe in both 2008 and 2012, carrying the county by more than 28,000 votes in 2012. Not only will Hillary Clinton’s margin in Arapahoe have a big impact on her overall statewide margin, but it could decide the winner of the competitive House race in the Sixth Congressional District. Democrat Morgan Carroll will need a strong showing in Arapahoe County, which houses more than 70 percent of the expected vote in that congressional district.
Bucks, Chester, and Delaware Counties (Pennsylvania)
We anticipate that both Clinton and Democratic Senate candidate Katie McGinty will win Philadelphia suburb Montgomery County. Accordingly, we will be following the Clinton and McGinty results in Bucks, Chester, and Delaware counties, which are more culturally conservative and further away from the City of Philadelphia. Delaware County tilts more Democratic than Bucks County and Chester County—President Obama received 60 percent of the two-way vote in Delaware County in both 2008 and 2012, whereas he faced much slimmer margins in Bucks and Chester County.
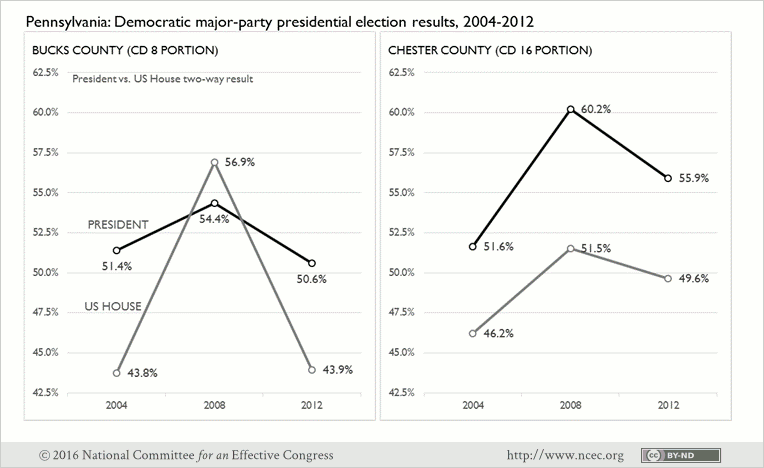
Taken together, these three counties are expected to contribute nearly 15 percent of the overall statewide turnout, and have a significant impact on competitive down-ballot contests. For example, Bucks County houses 89 percent of the expected vote in the 8th Congressional District, a competitive contest. Voter sentiments in Bucks County have fluctuated wildly in recent Congressional elections, as the Democratic House candidate received nearly 57 percent of the vote in 2008, compared to less than 39 percent in 2014. Similarly, Chester County contains a Democratic portion of the 16th Congressional District, a highly competitive open-seat contest between Democrat Christina Hartman and Republican Lloyd Smucker, giving us more reason to monitor these counties.
Iredell, Mecklenburg, and Wake Counties (North Carolina)
We expect Hillary Clinton, and Senate candidate Deborah Ross to run strongly in the urban areas of Raleigh (Wake County) and Charlotte (Mecklenburg County). Yet the more exurban outskirts of Wake and Mecklenburg may be more supportive of Republican Senator Richard Burr (and possibly Donald Trump), such as White Oak and Wake Forest in Wake County and Clear Creek Township and Deweese Township in Mecklenburg County. Beyond Mecklenburg and Wake Counties, the Charlotte exurb of Iredell County will be worth watching—in 2012, Mitt Romney enjoyed a 2-1 margin and a 23,000-vote plurality. Trump and Burr will carry Iredell County, but the trending margin may demonstrate a change in the county’s future voting behavior.
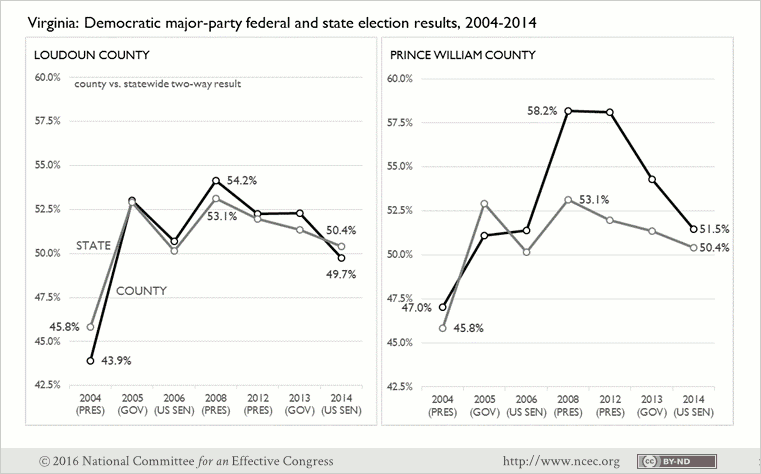
Loudoun and Prince William Counties (Virginia)
Fairfax, the largest county in the state, is now a Democratic bastion. However, emerging suburban counties Loudoun and Prince William are typically predictive of which party carries the state, and they are indicative of the amazing changes in Virginia’s voting behavior over the last 12 years. Hillary Clinton should carry both of these areas convincingly, which should assist Democratic candidate LuAnn Bennett in Virginia’s 10th Congressional District as she seeks to unseat Republican incumbent Barbara Comstock. Overall, Loudoun County and Prince WIlliam County account for more than 52 percent of the expected vote in the 10th Congressional District.
Trouble for the Republicans in Virginia may be getting even worse, as cities in southern Virginia, such as Chesapeake and Chesterfield—normally reliably Republican—could be moving in the Democratic direction. We’ve already seen other Richmond suburbs, such as Henrico drift heavily to Democrats.
| Locality | Kerry ’04 | Kaine ’05 | Webb ’06 | Obama ’08 | Obama ’12 | McAuliffe ’13 | Warner ’14 |
|---|---|---|---|---|---|---|---|
| Chesapeake | 42.6% | 51.7% | 47.7% | 50.6% | 50.5% | 51.7% | 49.8% |
| Chesterfield | 37.1% | 45.5% | 40.8% | 46.2% | 46.1% | 45.6% | 45.5% |
| Henrico County | 45.9% | 54.2% | 49.7% | 56.2% | 56.0% | 57.4% | 56.8% |
Lucas, Mahoning, Stark, Summit, and Trumbull Counties (Ohio)
It is highly unlikely that a Republican candidate can win Ohio without a plurality in Hamilton County, which includes Cincinnati. Donald Trump and Senator Rob Portman will win the Cincinnati exurbs—Brown, Clermont, and Warren—but the margin could be a crucial factor. In 2012, Mitt Romney carried these areas by more than 80,000 votes, which evidently was not enough of a margin.
| Democratic Presidential Margin | |||
|---|---|---|---|
| Area | 2004 | 2008 | 2012 |
| Lucas, Mahoning, Stark, Summit, and Trumbull Co. | 146,835 | 184,802 | 167,378 |
| Cincinnati exurbs (Brown, Clermont, Warren Co.) | -84,562 | -73,930 | -82,214 |
| State Total | -118,601 | 262,224 | 166,272 |
Trump’s fate, however, will be determined in blue-collar counties—Lucas County (Toledo), Mahoning County, Stark County (Canton), Summit County (Akron), Trumbull County. These areas have been central to the his campaign’s larger strategy. Should Trump achieve significant margins in these areas, it would be a large reversal from the 2012 election when Barack Obama carried these counties by combined margin of more than 150,000 votes. We know that Clinton will win heavily in Cuyahoga (Cleveland) and Franklin (Columbus). So Trump needs to score heavily in blue collar, exurban and rural Ohio. Also watch suburban Lake, positioned just outside of Cleveland.
Marion, Pasco, Seminole, and Volusia Counties (Florida)
Orange County (Orlando) was once considered a swing county, but we now expect Hillary Clinton to win big there. However, the Orlando exurbs, such as Marion County and Seminole County, will likely be much more competitive. Likewise, Pasco County, a Republican leaning county, may be important. If Clinton carries it, Trump will be in real trouble. In 2012, Romney won 53% of the vote there, which underscores how important a Clinton victory would be.
| County | Expected Share of vote | Kerry ’04 | Obama ’08 | Obama ’12 |
|---|---|---|---|---|
| Marion | 1.9% | 41.3% | 44.1% | 41.8% |
| Pasco | 2.5% | 45.1% | 48.2% | 46.6% |
| Seminole | 2.4% | 41.6% | 48.6% | 46.6% |
| Volusia | 2.8% | 50.8% | 52.9% | 49.4% |
History shows that the winner of Volusia County (Daytona Beach) often wins the state, despite the fact that Romney carried the county by nearly 1 point in his losing effort statewide. A Trump loss there could signal a bigger problem in the state, overall.
Cobb and Gwinnett Counties (Georgia)
Some observers expect Georgia to be the surprise of the 2016 election. Clinton will win overwhelmingly in Fulton (Atlanta) and DeKalb. Trump, conversely, is favored in the Atlanta exurban counties Cobb and Gwinnett—fast growing areas that are also changing demographically. Despite these changes, we don’t anticipate that Clinton will carry either county, but if the Trump margin is under 10 points in Cobb County and 5 percent in Gwinnett County, he may be in trouble statewide.
| County | Expected Share of vote | Kerry ’04 | Obama ’08 | Obama ’12 |
|---|---|---|---|---|
| Cobb | 7.8% | 37.5% | 45.2% | 43.7% |
| Gwinnett | 7.7% | 33.7% | 44.8% | 45.3% |