Democrats have won four of the last six presidential elections. Additionally, the Democratic nominee won the popular vote by 0.6 percentage points in 2000. That majority was not enough, however, to prevent the first election of Republican George W. Bush, who secured 271 of 538 electoral votes. From 2000 to 2012, the average Democratic margin was a narrow 2.3 percentage points, although that average increased to 5.6 percentage points for both of President Obama’s victories.
Other than the virtual deadlock in 2000 (ultimately decided by Bush’s 521-vote victory in Florida) the last time the electoral college contradicted the popular vote occurred in 1876. That election was decided by a controversial and biased commission that elected Republican Rutherford B. Hayes, despite a clear popular vote margin cast for Democrat Samuel Tilden. History shows that the popular vote winner has a 95 percent prospect of winning a majority in the electoral college.
History also informs electoral college projections. Analysts rely on recent presidential elections to predict the strategies of the two major political parties, wherein targeting the right combination of states maps a path to 270 electoral votes and, finally, the White House. Complicating the 2016 election is the antipathy that so many voters have expressed about the two presumptive nominees. That sentiment has fostered the prospect that a Libertarian candidate could upset the calculus, mirroring the impact of Ralph Nader’s campaign in the 2000 presidential election.
Hillary Clinton is this fall’s nominal front-runner, although recent polls have cast some doubt on the inevitability of her victory. With this in mind, we examine the difficult path that Donald Trump faces in trying to overtake Clinton.
A Narrowing Battleground (Looking Back at 2000)
We see the 2000 election as a benchmark, for two reasons. First, it was remarkably close—decided by 0.6 percentage points of the popular vote and five electoral votes. Second, it marked the first evidence that the South (with the exception of Florida, North Carolina, and Virginia) was closed off to Democratic presidential candidates. After all, Bill Clinton won Arkansas (his home state), Kentucky, and Louisiana in 1996—all states that are now considered part of the Republican base.
In 2000, seven states were decided by a margin under 2 percentage points. Today, in an era marked by extreme polarization, only four of those states—Florida, Iowa, New Hampshire and Wisconsin—are top targets this November. Minnesota leans Democratic and both New Mexico and Oregon are now solidly Democratic. Simply put, the competitive map has shrunk significantly.
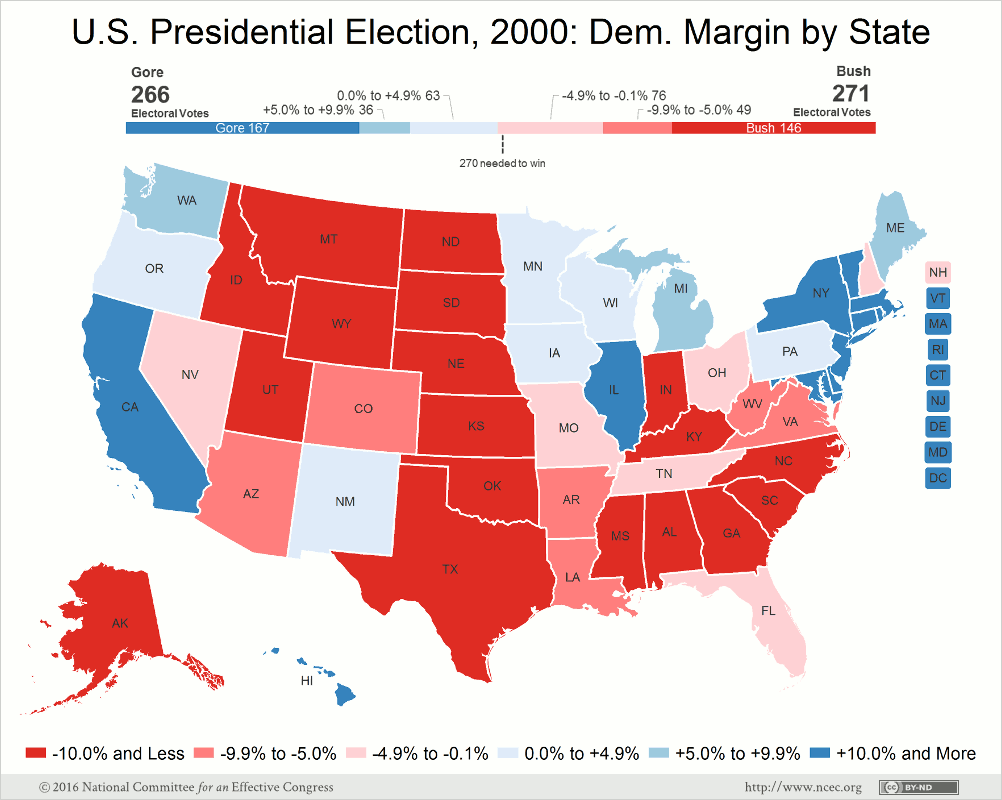
Even states that were moderately competitive in 2000 have become far more partisan. For example, Maine and Washington (where Gore finished 5 percentage points ahead in 2000), are now reliably Democratic. On the flip side, Tennessee and West Virginia are now reliably Republican. Missouri remains an interesting case because Obama came within 1 percentage point of carrying the state in 2008, only to lose the state by 9.4 percentage points in 2012.
Two additional states, Michigan and especially Pennsylvania, have leaned Democratic over the past four presidential elections but are potential 2016 targets.
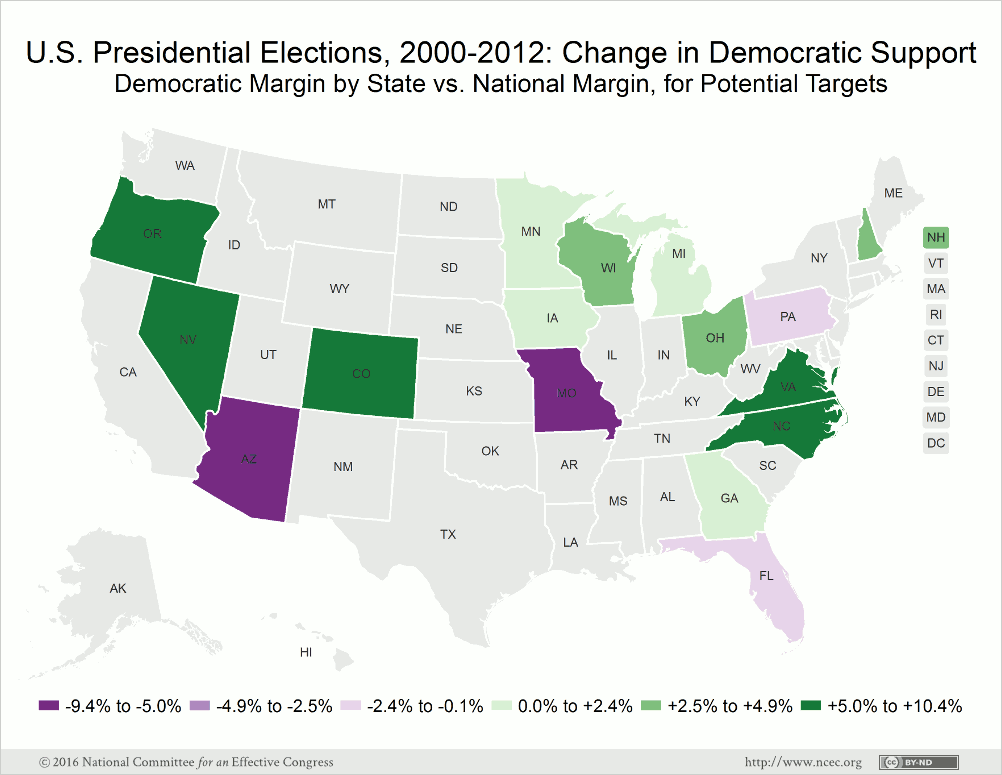
Colorado has experienced a dramatic shift (partly due to demographic changes) from a solidly Republican stronghold to a battleground state that is now considered a toss-up that leans Democratic. In general, white voters in Colorado have been far more receptive to Democratic candidates. The data show that Democrats performed 8.9 percentage points below the national norm in 2000, compared to 1.5 percentage points above in 2012, an incredible change in that time period.
Nevada has evolved along the same lines as Colorado. In 2000, Bush won the state by a 3.5-point margin, 4.1 points more Republican than the national margin. By 2012, the state shifted to 2.8 points more Democratic.
Perhaps the most important advantage Democrats possess right now is that a majority of marginal states were irrefutably more supportive of Democrats in 2012 compared to 2000. This is especially true of southern states with suburban growth (North Carolina and Virginia) and states experiencing pronounced demographic change (Colorado and Nevada).
Given these trends and the contracted field of competitive states, the path to victory for Donald Trump becomes increasingly complicated. In order to win, Trump will focus his efforts on states where demographic change is less pronounced—attempting to walk a very thin line to victory.
The 2016 Election
The Demographic Advantage for Democrats
For the last two presidential cycles, the theme of an “emerging Democratic majority” has dominated national political analyses. Long-term demographic trends will prove disastrous to Republican candidates unless their party reverses its policies toward Latino and, increasingly, Asian voters. It is often overlooked that the Asian-American population is growing at a faster rate than the Latino population. Combined, these two groups could represent as much as 15 percent of the electorate this November.
The Base Vote
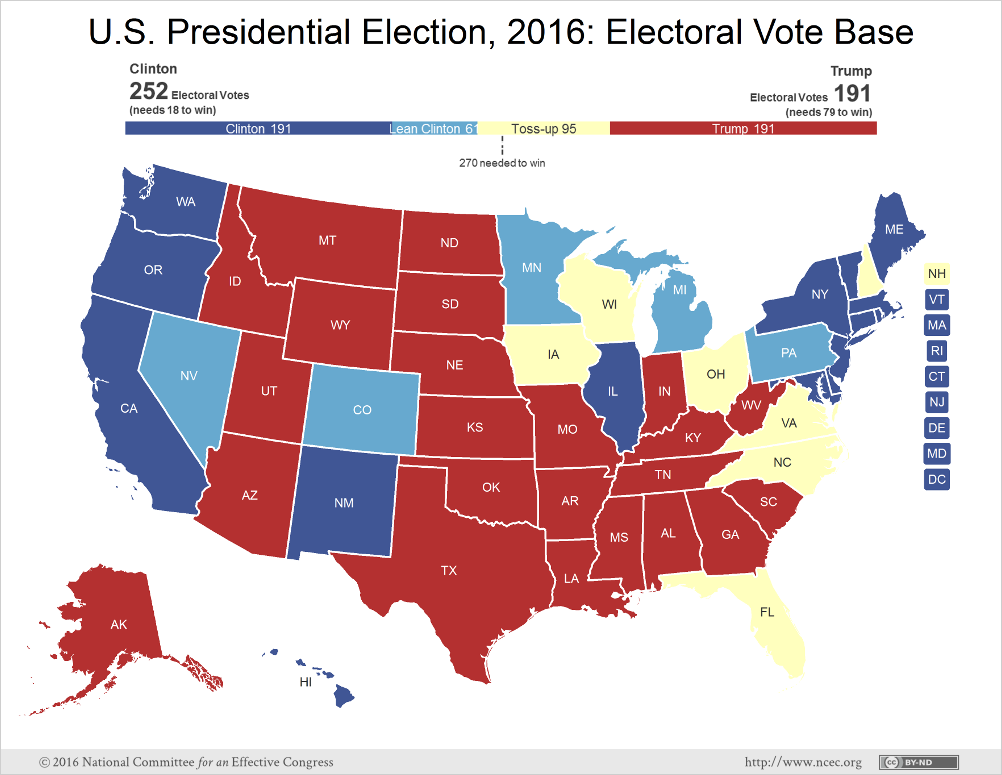
Any analysis of the Electoral College should begin by looking at the base support for each candidate. Most analysts give Hillary Clinton an inherent advantage, starting with as many as 252 electoral votes. She is the indisputable favorite in 15 states and the District of Columbia which together represent 191 electoral votes. There are five additional states, representing 61 electoral votes, where she appears the likely favorite—Colorado, Michigan, Minnesota, Nevada, and Pennsylvania. Based on recent elections, this is a plausible starting point for Clinton’s 2016 electoral vote total.
Donald Trump also starts with a foundation of 191 electoral votes. They are found in 23 states, mostly in the South and Mountain West, that have consistently voted for the Republican presidential candidate in recent elections. This leaves him 79 electoral votes short of victory, to be made up in states that have shown a tendency to vote Democratic in the past or in states that are trending Democratic. Should Clinton hold her base states and those where she has an advantage, she would only need another 18 electoral votes from available toss-up states to win the election. The Trump strategy must necessarily focus on states where Democrats have enjoyed a traditional advantage. More specifically, he will have to capture Midwestern states that currently favor Clinton this November.
Our calculations show 12 states that will be the focus of this election, with 7 true toss-up states. The true toss-ups account for 95 electoral votes, although North Carolina’s inclusion on this list might inspire some dissension. Recent polls also offer the tantalizing prospect of Georgia being up for grabs this year; we will include it with the 23 states that are likely to be won by Trump. Several observers contend that demographics might catapult Arizona into play. However, recent polls and the 9.1-point advantage amassed by Mitt Romney in 2012 cast doubt on that idea. Nevertheless, Arizona will undoubtedly be a competitive state in future cycles.
Predicting the Outcome in Toss-up States
Comparing the 2012 vote margin per state to the national margin (3.9 percent) highlights the relative strength of the Democratic vote in competitive states.
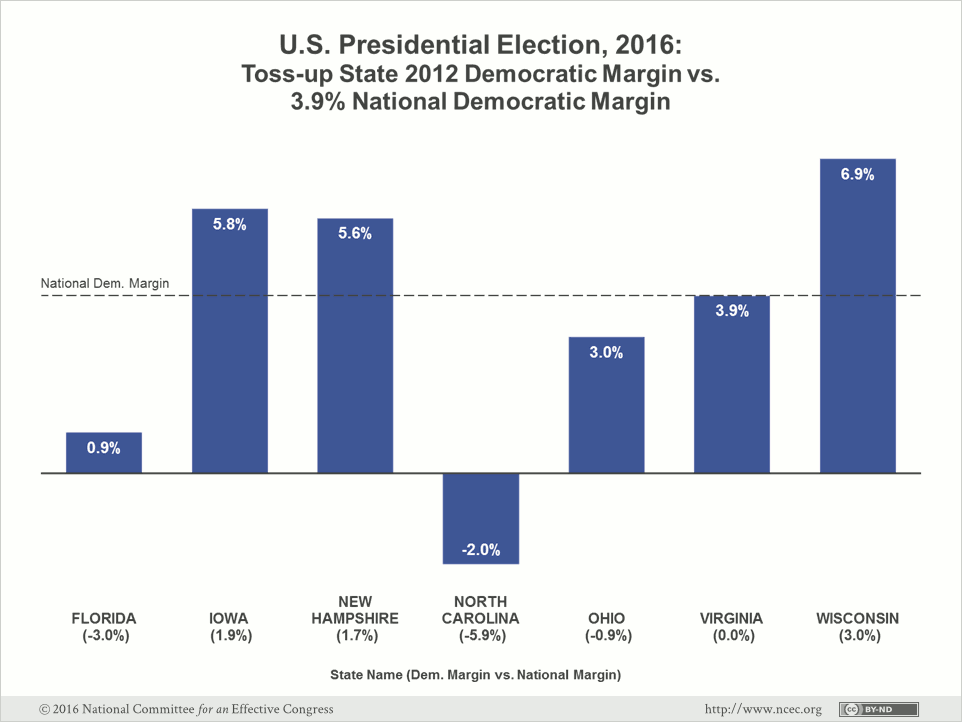
Most of these states have voted Democratic in recent presidential elections, but they have shown enough volatility in recent cycles, both presidential and midterm contests, to be considered toss-up states in November. The table below shows the last time the Democrats lost each each of the current toss-up states:
| Battleground State | Last Republican Victory |
|---|---|
| Florida | 2004 |
| Iowa | 2004 |
| New Hampshire | 2000 |
| North Carolina | 2012 |
| Ohio | 2004 |
| Virginia | 2004 |
| Wisconsin | 1984 |
Florida: Florida was the state with the narrowest margin in 2012, with Obama reaching a scant 0.9-point margin. Exit polls suggest that Obama won 95 percent of the African-American vote but without him heading the ticket, there is a likelihood that the Democratic share of the African-American vote will drop to between 90 and 92 percent. Still, Clinton is expected to significantly outperform John Kerry’s 86 percent share in the 2004 election. However, Democratic gains with young Cuban American voters, along with the rest of the rapidly growing Latino population, might offset a slight erosion of the Democratic share of the African-American vote. The Latino share of the eligible voting population in Florida has grown by 4.4 percentage points over the last 12 years, giving the bloc much more power to shift the outcome.
Iowa: George W. Bush won Iowa in 2004—the last time a Republican carried the state. Still, his margin was 1.8 percentage points below his national advantage. The challenge for Democrats against Trump is winning over the large number of socially conservative rural and small-town voters who have been leaving the Democratic Party. Although midterm election results are typically not indicative of presidential election performance, Republicans scored massive victories in the gubernatorial and U.S. Senate contests in 2014. Should Clinton’s share of the white vote drop, as some polls suggest it will, this could be fertile ground for Donald Trump.
New Hampshire: The election of 2000 was the last time a Republican won New Hampshire. In both 2008 and 2012, the Democratic margin in New Hampshire was similar to the national margin (2.3 percentage points above in 2008 and 1.7 above it in 2012). While New Hampshire contains a large number of rural small-town voters, the migration of former Massachusetts residents to the suburbs in southern New Hampshire has buttressed Democrats in recent elections. However, two recent polls reported a 2-point margin between Clinton and Trump, indicating a potentially closer race this November.
North Carolina: Demographic changes will have more impact in North Carolina than in any of the other toss-up states (with the exception of Florida). Unlike elsewhere in the country, the growth of largely white suburbs in Charlotte and Raleigh-Durham hint at trouble for Donald Trump as voters in these suburbs are more liberal than most. The African-American vote projects at 23 to 26 percent of the total vote; if it reaches 26 percent—and Clinton comes close to matching the 96 percent support garnered by Obama in 2012—she has a good chance to win the state. The loss of North Carolina would deal a crippling blow to Trump. Still, apart from Obama in 2008, Republican presidential candidates have carried North Carolina every year since 1976.
Ohio: No Republican has ever won the White House without carrying Ohio. Obama won it by 3 percentage points in 2012 (0.9 points below the national margin). But there is evidence that Obama’s coalition will be difficult to replicate this year, as we pointed out in our article on May 20. Census data reveal that 11.4 percent of the eligible Ohio voting population is African-American. Estimates of the share of African-Americans voting in 2012 vary from 13 to 15 percent according to national exit polls, with Obama securing at least 95 percent of the black vote. In a simulation of the 2016 election, assuming that both white and black turnout are consistent with their respective shares of the eligible voters, the state would flip to the Republicans even if Hillary Clinton wins 40 percent of the white vote. A complicating factor for Democrats in Ohio, unlike in Florida, is the relatively small Asian and Latino voting population. The eligible Ohio electorate in 2016 is likely to be 84 to 85 percent white. Blue collar suburbs around Cleveland, the exurbs surrounding Cincinnati, and the small-town northern tier of the state may all flock to Donald Trump in this election.
Virginia: Virginia is another state that is undergoing rapid suburban growth—both in Northern Virginia and the Richmond suburbs. The white share of the eligible population has been slowly declining and more than 30 percent of the 2012 vote was cast by minorities. Minority turnout contributed to the Democratic margin in Virginia equaling the national Democratic margin. The following year, African-American turnout in Hampton Roads and Richmond helped elect Clinton ally Terry McAuliffe as Governor. There is a marked trend toward the Democrats here, after years of consistently losing the state.
Wisconsin: Although Democrats have won this state every year since 1984, and Obama won the state by 6.9 percentage points in 2012 (3.1 points better than his performance nationally). Results from rural, small town Wisconsin suggest some traction for Trump. Obama won 48 to 50 percent of the white vote in 2012 but it is not certain that Clinton can match this result in November.
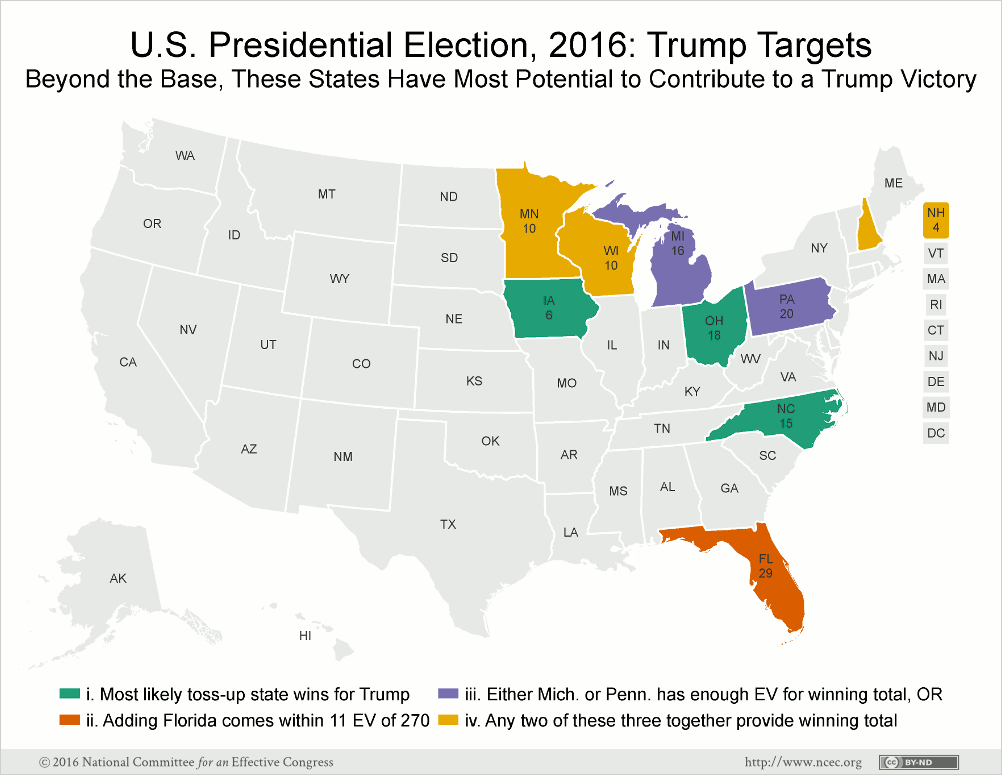
Given recent election results and existing demographics, we believe that Iowa, North Carolina, and Ohio are the three toss-up states that are most likely to end up in the Republican column. Winning these three states would add 39 electoral votes to Trump’s total, leaving him 40 votes short of an Electoral College majority. Even winning Florida would leave him 11 votes short of victory, demonstrating the difficulty of his path.
For this reason, we believe Trump’s path to victory could only be through the Midwest, where an elevated white vote share could make the difference. To reiterate, if Trump wins his base states plus Iowa, Florida, North Carolina, and Ohio, he is still 11 votes short of an Electoral College victory. Trump could overcome this deficit by carrying Michigan (16 votes) or Pennsylvania (20 votes) alone, or through a combination of Minnesota (10 votes), New Hampshire (4 votes), or Wisconsin (10 votes).
Demographic developments in Colorado, Nevada, and Virginia have made these states increasingly difficult for the Trump campaign. By recent election standards, the loss of the three states would spell defeat for the Republicans. Nevertheless, there are scenarios where Trump can rely mainly on the white vote to capture the 270 electoral votes necessary to win.
Trump’s Best Case Scenario
In addition to the 191 electoral votes from the 23 base states, Trump could win North Carolina, and experience a great deal of success in the Midwest, winning Iowa (6 votes), Michigan (16 votes), Ohio (18 votes), and Pennsylvania (20 votes), while adding Minnesota (10 votes) or Wisconsin (10 votes). This would give him 276 electoral votes.
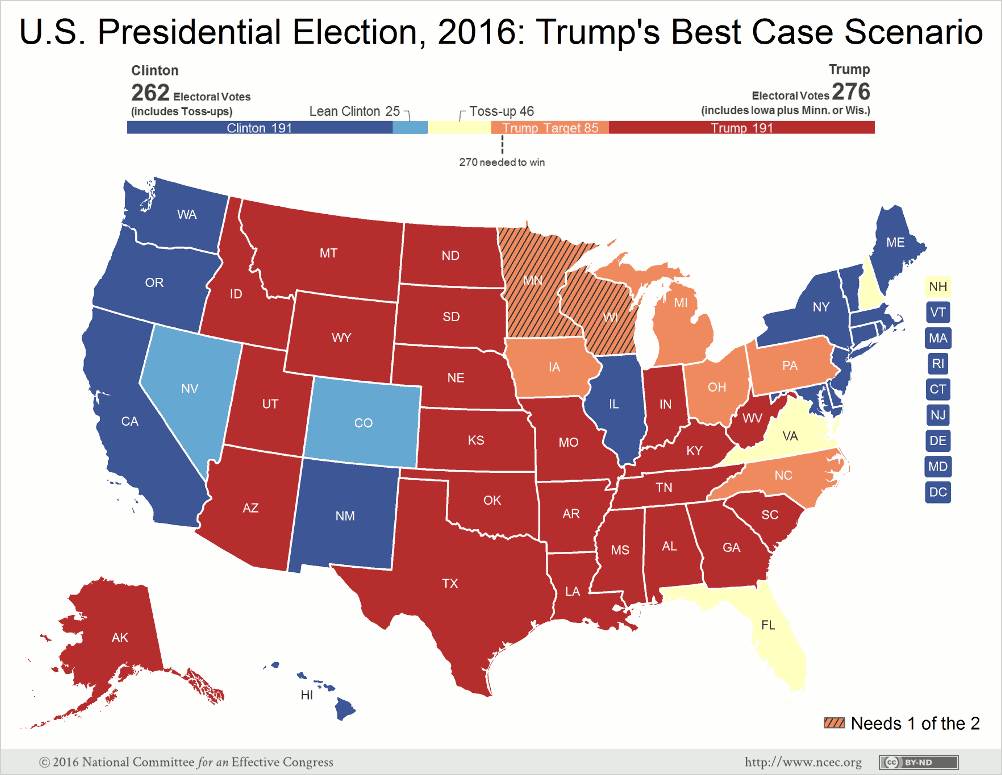
But given the trends in recent elections, this best case scenario seems highly unlikely, especially with regard to Michigan, Minnesota, and Wisconsin. But like the other industrial Midwest states, these are areas where the minority population is growing at a slower rate and Trump’s anti-trade rhetoric could resonate with local voters.
A Midwest Sweep: Winning Without Florida or Pennsylvania
Since the turn of the century, the vast majority of presidential election analysis has centered on Florida and Ohio along with other swing states like Colorado, Pennsylvania, and Virginia. As in 2004, the linchpin of the Republican strategy will almost certainly be Ohio. Trump has one highly implausible path to victory where, of the states mentioned above, he carries only Ohio. We refer to this scenario as a “Midwest sweep” because it requires Trump victories in multiple Midwestern states that are traditionally Democratic.
In addition to the 191 electoral votes from the 23 base states plus North Carolina (an additional 15 votes), Trump could extend this Midwest strategy by winning Iowa (6 votes), Michigan (16 votes), Minnesota (10 votes), Ohio (18 votes), and Wisconsin (10 votes). This would give him 266 electoral votes. If he also carried New Hampshire, he would reach the necessary 270 votes and win the presidency. New Hampshire, though we list it as a toss-up, leans Democratic in presidential elections and a Trump victory here is less than a 50-50 prospect.
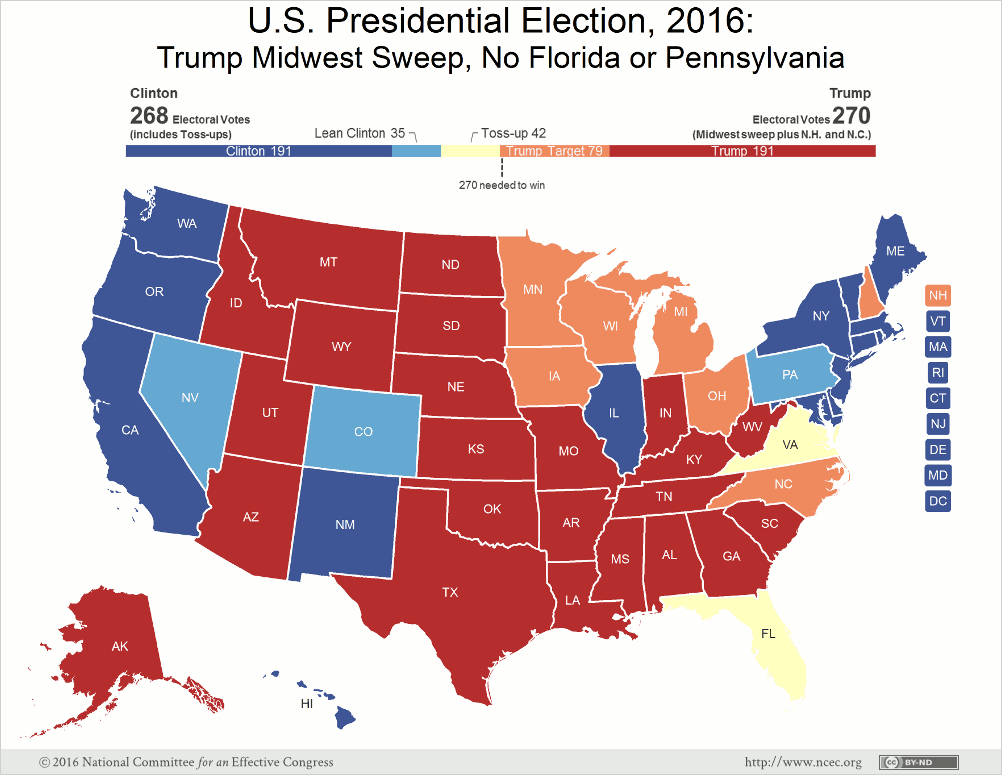
It is highly unlikely that the toss-up states would align in such a way, with the Midwest and New Hampshire uniting behind Trump. However, Trump has defied expectations throughout the primary process and it remains possible that his campaign could continue to defy expectations into the general election.
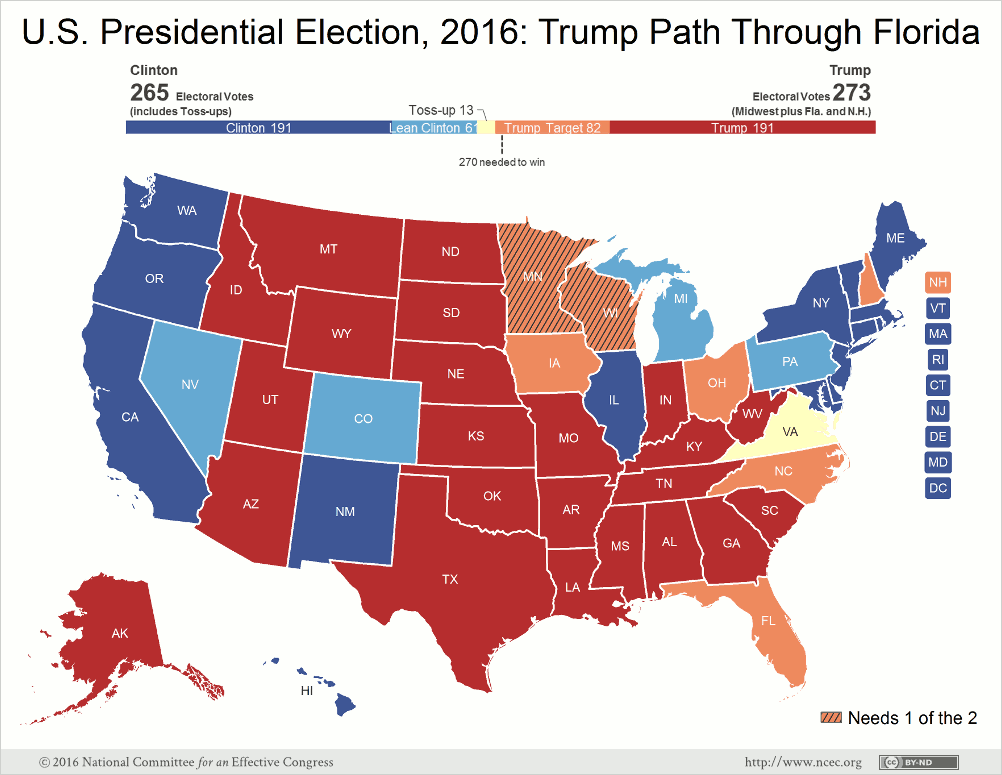
The Path Through Florida (A More Traditional Republican Scenario)
In addition to the 191 electoral votes from the 23 base states, Trump could carry Florida (29 votes), New Hampshire (4 votes), and Ohio (20 votes)–the traditional swing states—while also winning Iowa (6 votes), North Carolina (15 votes), and Minnesota (10 votes) or Wisconsin (10 votes). Like the previous scenario, this pathway relies heavily on winning marginal states with a greater share of non-college voters and less demographic turnover. But Florida becomes the key to victory in this scenario. To carry Florida, Trump will have to cut into Clinton’s advantage with older voters as well as the growing population of Florida’s exurbs in the Orlando, Pensacola, and Tampa media markets.
Conclusions
Looking at the Electoral College map, Hillary Clinton undoubtedly holds an advantage. But while much analysis between now and Election Day will be devoted to the traditional swing states and the influence of America’s changing population, the Trump campaign’s only viable path to victory is through the Midwest. In stark contrast to strategies employed by John McCain and Mitt Romney, the Trump campaign will look to side-step current demographic realities. While the two previous Republican nominees attempted to compete in states undergoing a rapid demographic shift, Republican strategy in 2016 will focus on winning over the traditional Democratic base in the industrial Midwest. Ohio and its surrounding states will have to be the top prize for Donald Trump.